Is Your Dealership Website Costing You Leads? A DIY Audit Guide
Your website has a job to do before a buyer ever walks onto your lot: help them find the right boat or RV, answer their questions, and make it easy to contact your team.
If your sales team is working harder to earn every deal, your website needs to work harder, too. A slow inventory page, a listing that search engines cannot find, or a frustrating inquiry form can get in the way of the leads you are already trying to generate.
You do not need to be a developer to spot the warning signs. This guide walks marine and RV dealership owners and GMs through a first audit of speed, search and AI visibility, and trust. Set aside about 30–45 minutes for the first pass; a larger site crawl can take longer.
Jump to: Choose your pages · Speed · Search and AI · Trust · Your fix list
Why your website deserves this attention
Buyers can research online and still buy in person. In Rollick’s research across recreation categories, 74% preferred finding available inventory online, while 80% preferred completing the transaction at a dealership. Those preferences cover the combined marine, RV and powersports sample. The practical lesson is that your digital showroom helps earn the physical visit. Read Rollick’s research, page 2.
Think about three moments in that journey:
- Can a shopper use the page? Photos should appear promptly, filters should respond, and buttons should stay where the shopper expects them.
- Can the shopper find you? Your locations, brands, inventory and services need clear, discoverable pages.
- Can the shopper confidently take the next step? Contact forms, accessibility, privacy information and basic browser protections all deserve attention.
The aim is to find the obstacles between a shopper and an inquiry, then give your provider a specific fix list.
Start with three pages, not just your homepage
Copy these three URLs into a note or spreadsheet:
- Homepage: your dealership’s main entrance.
- Inventory results page: where shoppers browse and filter boats or RVs.
- One active inventory detail page: a specific unit with photos, specifications and an inquiry button.
For a multi-location dealership, add a location page. Use the same URLs when you retest. Save the date, device setting, report link and a screenshot with each result so you can compare like with like.
Before running a scanner, open the pages on your phone. Find a unit, change a filter, open the photo gallery and start an inquiry. Note anything that makes you wait, lose your place or wonder what to do next.
1. Speed: can shoppers reach and use your inventory?
Page speed affects the experience you deliver to visitors from ads, search, social media and direct visits. Google also considers Core Web Vitals in its ranking systems, although good scores alone do not guarantee a top position. Google’s Core Web Vitals guidance.
Run the check
- Open PageSpeed Insights.
- Paste your homepage URL and select Analyze.
- Start with Mobile, then review Desktop separately.
- Find the real-user section and its Core Web Vitals Assessment. Record whether it reports Passed, Failed, or insufficient data.
- Note whether the result is for This URL or the broader Origin. An origin result describes the site’s collected experiences; it is not a separate measurement of every listing.
- Scroll to the diagnostic section to see the Lighthouse results and suggested improvements.
- Repeat for your inventory results page and the individual listing.
Know what the numbers mean
- Largest Contentful Paint (LCP): 2.5 seconds or less. Measures how quickly the largest visible content element appears.
- Interaction to Next Paint (INP): 200 milliseconds or less. Measures how quickly the page responds to an interaction.
- Cumulative Layout Shift (CLS): 0.1 or less. Measures how much content unexpectedly shifts.
These are real-user targets evaluated at the 75th percentile. LCP is not the time it takes every element on the page to finish loading. Web Vitals definitions and thresholds.
PageSpeed’s field data reflects a rolling 28-day period. Its Lighthouse performance score comes from a simulated test. They can disagree because they measure different conditions. Missing field data means the tool lacks enough data for that assessment; it does not mean the page automatically passes or fails. How PageSpeed Insights works.
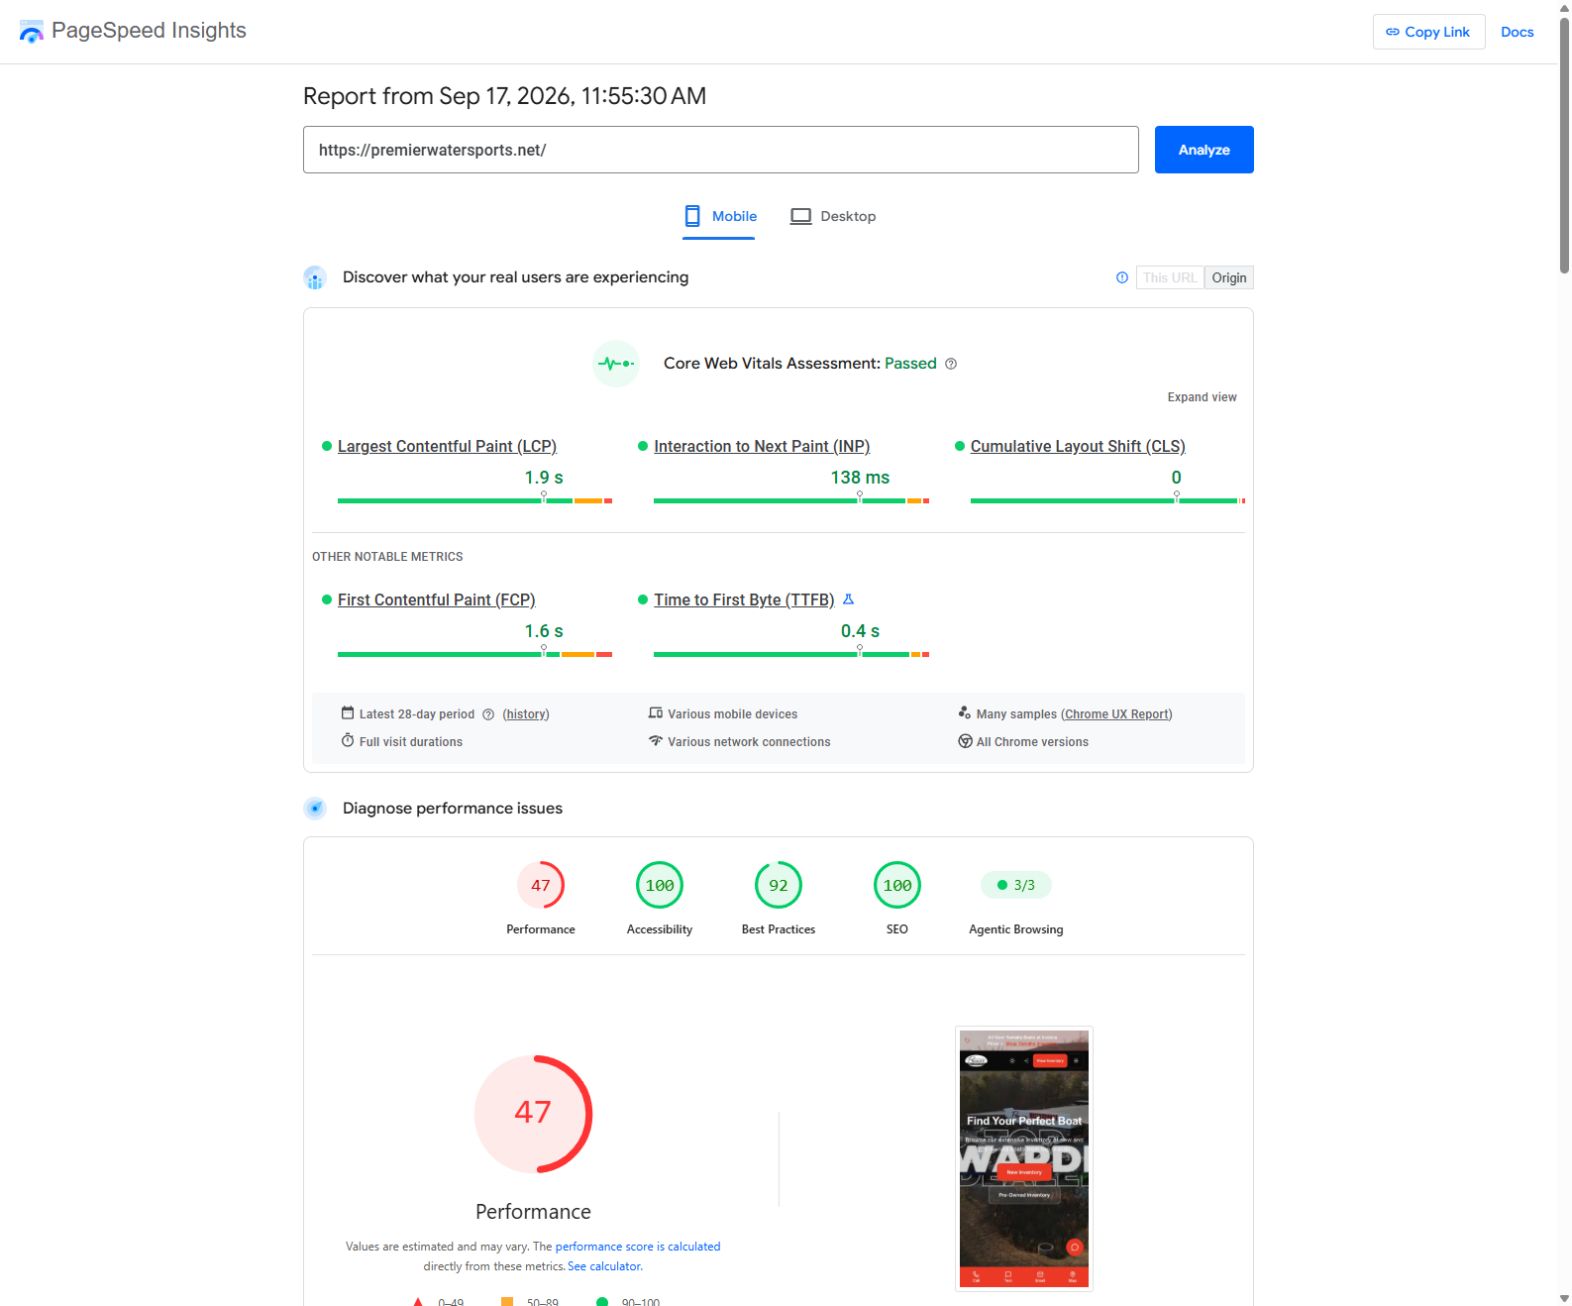
In our September 17, 2026 capture, Premier Watersports passed the mobile, origin-level assessment with LCP of 1.9 seconds, INP of 138 milliseconds and CLS of 0. The same screen shows a lab performance score of 47. Both results belong in the conversation: preserve the good real-user experience and investigate the diagnostic findings.
What to ask your provider
Send the reports and ask: “What is delaying the main content or making these pages slow to interact with, and what will you change?” Ask them to investigate image sizing, third-party scripts and the specific diagnostics affecting your pages. A change to an inventory template may improve many listings at once.
Retest the same pages and device setting after the work. Use lab tests for immediate feedback, then follow the field trend as new visits enter the reporting window.
2. Search and AI visibility: can people find and understand your dealership?
Organic visibility gives you opportunities to earn visits without paying an advertising fee for each click. The content and maintenance still take work. Your audit should establish whether your site clearly explains who you are, where you operate, and what you sell.
Check the searches a buyer would make
Try a handful of relevant queries, such as “boat dealer in [city],” “[brand] RV dealer near [city],” and a model you currently stock. Look at the search results, maps listings and landing pages. Record the query and date; results vary by location and other factors.
Then open your own location and inventory pages. Can a shopper quickly find the dealership name, address, phone number, brands, unit details and next step? Make sure that important information is readable text, not only lettering inside an image.
If you or your provider has access to Google Search Console, use URL Inspection on the three pages. Review their indexing status and the reason given if a page is excluded. A live test helps investigate current accessibility to Google; it is not a promise of indexing or ranking. URL Inspection instructions.
Use Lighthouse for a first technical SEO check
You can start with the SEO results in PageSpeed Insights. To run Lighthouse inside Chrome, open the page, open Developer Tools, choose the Lighthouse panel, select the relevant categories and mobile device setting, and run the analysis. If the panel is hidden, look in the DevTools overflow menu. Chrome’s Lighthouse instructions.
Open the failed checks rather than recording only the headline score. Ask your provider about issues affecting crawl access, page titles, descriptions and links. A score of 100 is a pass on that tool’s checks, not proof that your dealership ranks well.
Check structured data on the homepage and a listing
Structured data gives machines explicit information about a page’s content. For a dealership, that might describe the business, its locations and the unit on an inventory page. The markup should match the information people can actually see. Google’s structured data introduction.
- Open the Schema.org validator.
- Start a new test, choose the URL option, and enter your homepage.
- Review the detected types and expand them to inspect the actual values.
- Repeat with an individual boat or RV listing.
- Save errors, warnings, missing information or details that do not match the page.
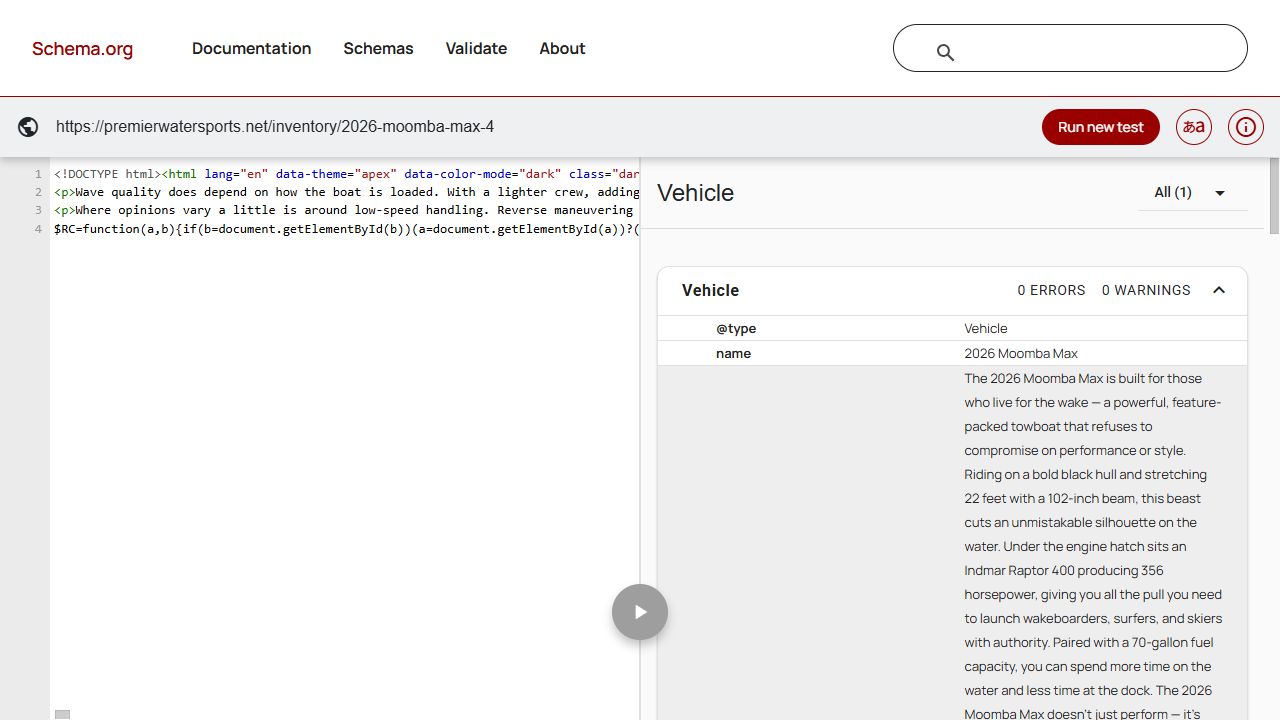
Our recorded Premier listing example exposes Vehicle data with zero validation errors and warnings. That is useful evidence that the markup parses. Your provider should still verify that the chosen types and properties accurately describe your business and inventory. Use Google’s Rich Results Test separately to check supported Google search features; not every Schema.org type has a Google rich result.
Where AI fits
AI visibility is another reason to publish clear, current information that systems can retrieve and understand. Google says its AI search features use the same foundational SEO practices and do not require special AI schema. Accurate markup can help describe content, but it does not guarantee a recommendation in Google, ChatGPT, Claude or another service. Google’s guidance for AI search features.
Ask your provider to check crawl restrictions, page accessibility and the facts your site presents about your locations, brands and inventory. Treat answers from an AI service as a spot check—not a complete visibility report.
Go deeper with a site-wide audit
If you have Semrush, open your project’s Site Audit, run a current crawl and review the overview. Record Site Health and the available AI search health/readiness report, then open the actual issues. Check the crawl date, page limit and settings before comparing runs.
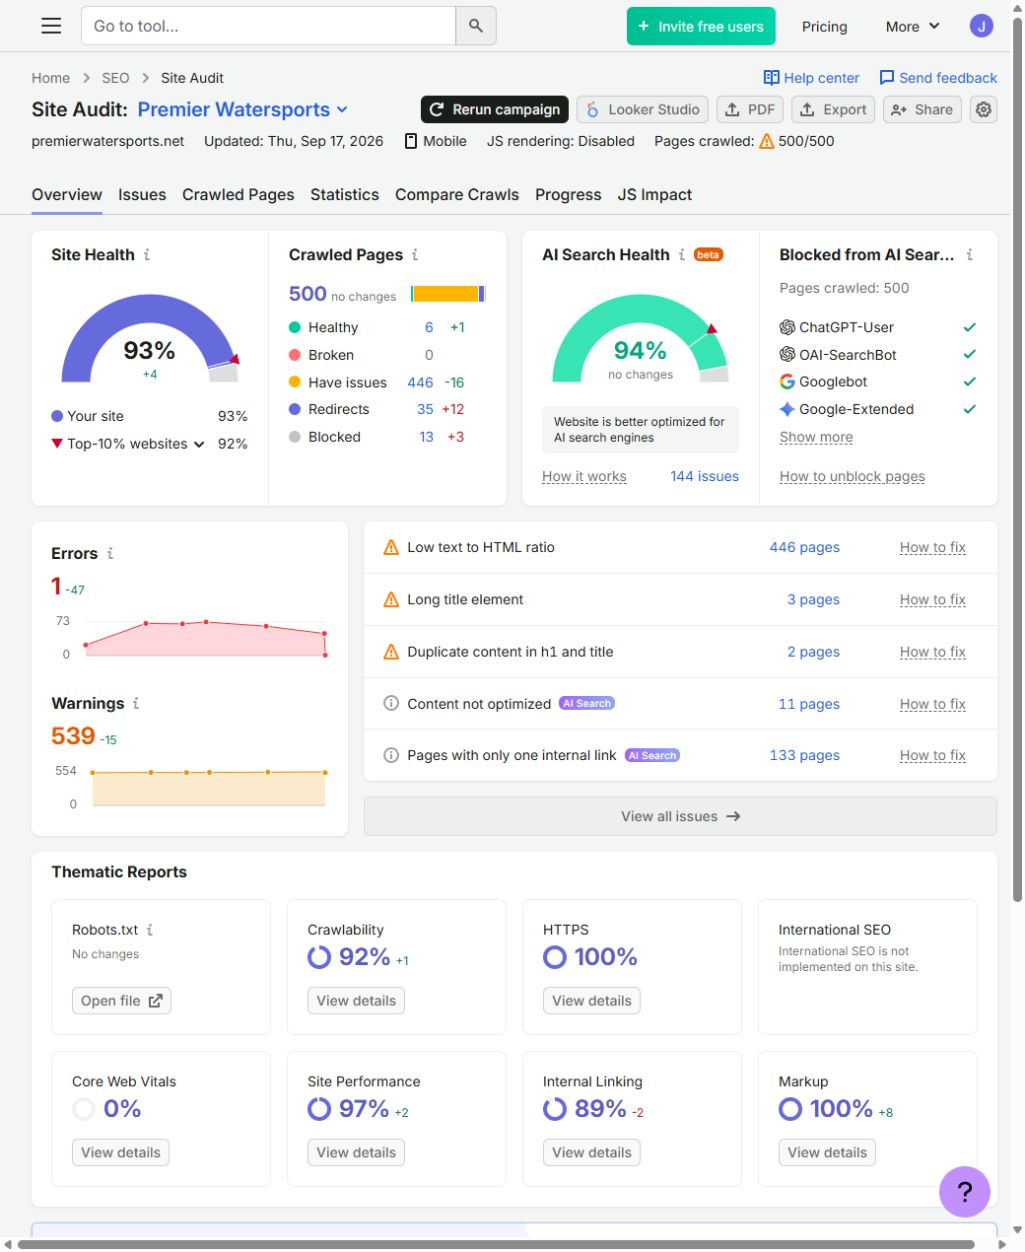
Premier’s September 17, 2026 overview shows 93% Site Health and 94% AI Search Health. The screenshot also lists remaining issues. These are Semrush audit scores for that crawl, not Google rankings, an AI recommendation rate or proof that every page is problem-free.
Ask your provider: “Which indexing, content and structured-data issues affect our important pages, and how will you verify the fixes?”
3. Trust: can every shopper confidently take the next step?
Trust becomes practical when someone tries to contact you. A blocked form, unreadable error message or broken mobile button can end that conversation before your sales team knows it existed.
Check browser protections with Security Headers
- Open Security Headers.
- Enter your public website URL. Use Hide results if you do not want the scan listed publicly, and follow redirects to the final page.
- Run the scan and save its date, grade, missing headers and warnings.
- Ask your provider to explain the findings and test any changes against your forms, chat and other integrations.
Security headers tell the browser how to handle aspects of the page securely. The grade covers the scanner’s checks; it does not certify the security of the whole website. Security Headers FAQ.
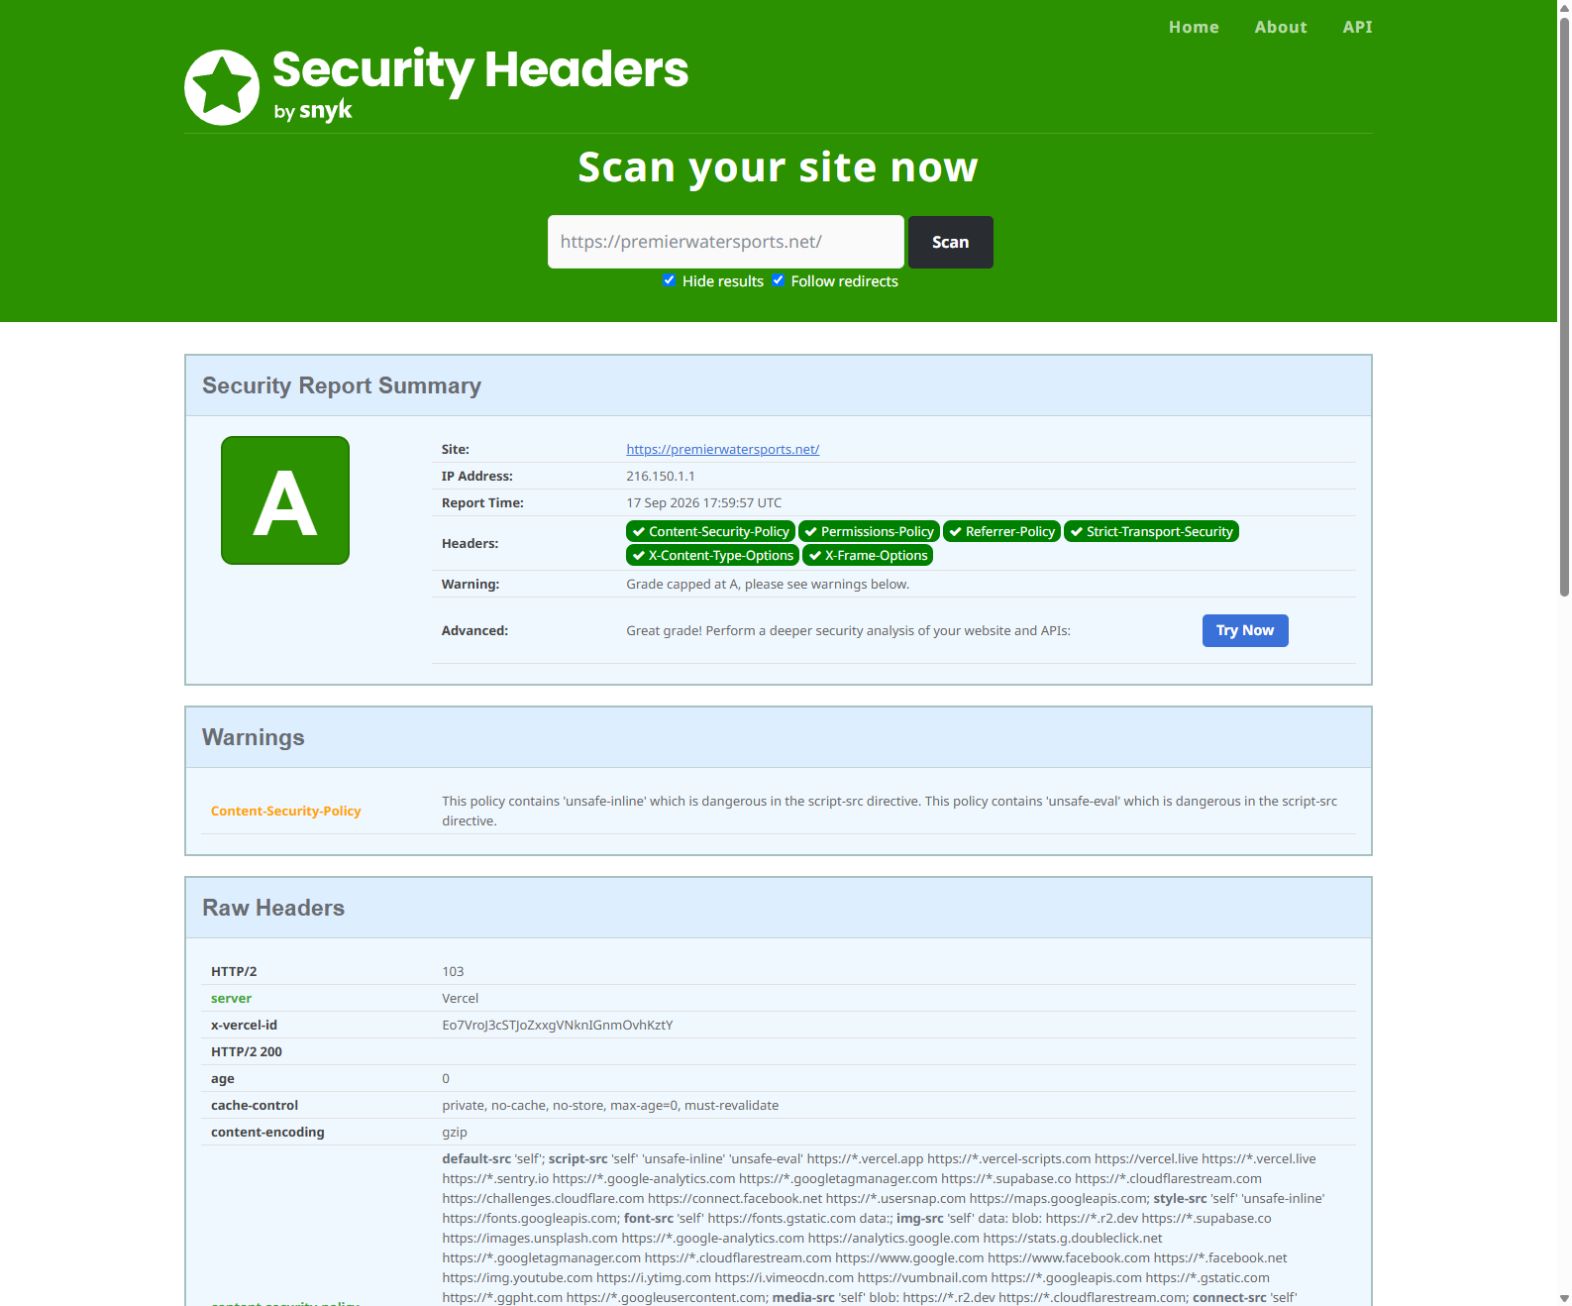
Premier’s captured scan received an A, while still displaying Content Security Policy warnings below it. Read those details even when the large grade looks good. A poor grade also does not, by itself, mean a site has been hacked.
Combine an accessibility scan with real tasks
Run the Accessibility category in Lighthouse, then try the buying journey yourself:
- Use Tab and Shift+Tab to move through navigation, inventory filters and the inquiry form. Check that you can see which control is selected and can use it without a mouse.
- Increase browser zoom to 200%. Check that important information and form controls remain usable.
- Review field labels and required-field errors. A shopper should understand what is being asked and how to correct a mistake.
- On your phone, check that chat windows and banners do not cover the inquiry button or essential information.
An automated score cannot establish full accessibility. These tasks are a first pass; a more complete review includes assistive-technology testing. W3C’s introductory accessibility checks.
Follow the inquiry all the way through
Coordinate a clearly labeled test inquiry with your team. Confirm that the shopper receives the expected confirmation, the lead reaches the right inbox or CRM, and someone is responsible for responding. Avoid putting sensitive financial details into a test form.
Also check that privacy information and any relevant choices are easy to find and work as described. Ask your provider and advisor to review your actual data practices and applicable obligations; a cookie banner or scanner grade is not a legal compliance assessment.
Turn the findings into a fix list
Use one row per finding. Record the page URL, device, date, report link, customer impact, responsible person and retest date. Keep the scope visible: a page result, a site-wide crawl and an origin-level measurement answer different questions.
For your first pass, check off the following:
- Homepage, inventory results and an active listing tested on mobile.
- Core Web Vitals status, scope and metrics recorded separately from Lighthouse scores.
- Important pages reviewed in search and, where available, Search Console.
- Homepage and listing structured data checked for errors and inaccurate details.
- Security-header findings reviewed, including warnings beneath the grade.
- Keyboard, zoom and mobile inquiry tasks tried by a person.
- A test inquiry confirmed in the correct inbox or CRM.
Fix the biggest obstacles first
First: address broken inquiries, inaccessible controls, security concerns that need prompt investigation, and important public pages unintentionally excluded from search.
Next: tackle problems shared by high-value templates, such as slow inventory pages, missing listing information or repeated structured-data errors.
Then: work through lower-impact warnings, improve useful content, and make repeat audits part of website maintenance.
Do not measure success only by a greener score. Compare qualified inquiries and inquiry rates over matching periods, accounting for traffic, seasonality, inventory, advertising and tracking changes. Keep appointments and sales in view, too.
Send this to your website provider
We audited our homepage, inventory results page and an active unit listing. Please review the attached reports, identify the causes of the issues affecting shoppers, and propose the fixes in priority order. For each item, include an owner, expected timing, cost and how we will verify the result. Please distinguish page-level results, origin-level field data and simulated tests, and confirm that inquiry delivery still works after the changes.
Make your website work harder
You now have a way to move beyond “our website seems fine” or “it feels slow.” You can show what happened, where it happened and what needs attention.
Dealer Edge brings website performance, search foundations and the customer inquiry experience into the same conversation. If you would like help interpreting your results, request a free website audit. We will help you understand what is helping, what is getting in the way, and what to prioritize next.
Adapted from Jason LaBaw’s Dealer Edge website-audit walkthrough. Premier screenshots are retained examples captured September 17, 2026; run fresh tests for your own site. Guide prepared September 22, 2026.
Put your website to work.
Bring us your audit results. We’ll help you identify what is costing you opportunities and which improvements to tackle first.